How Bad is the UK Heatwave Problem? Part 1: Compare 1947
Recent UK heatwaves may not represent the most extreme possible in the current climate, with the early June 1947 heatwave, for example, being more anomalous for the climate of the time.
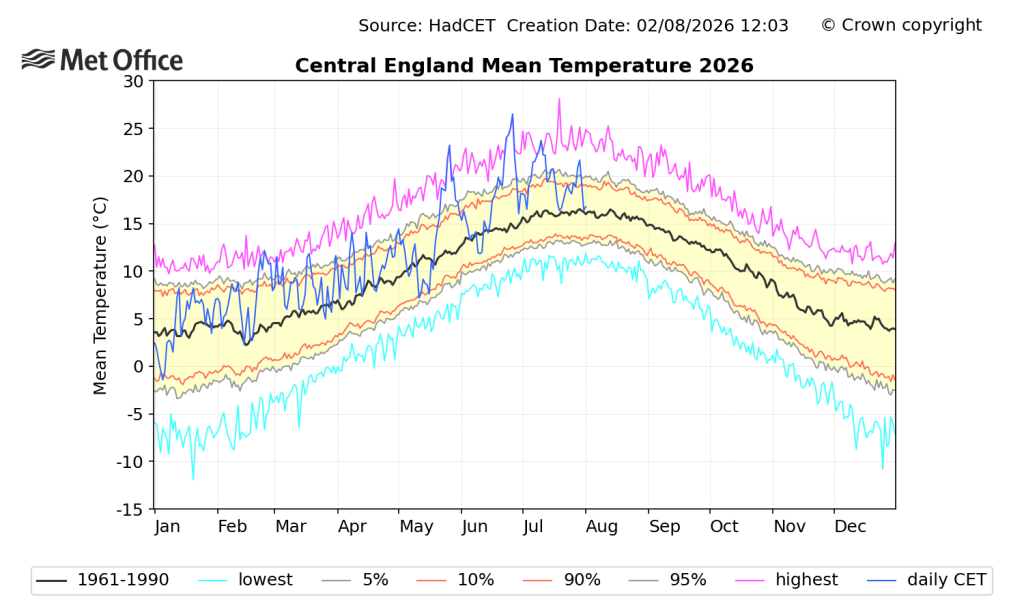
Since I last posted, early in July, periodic heatwaves have continued in the UK. The blue line in Fig 1 represents this year’s daily mean Central England Temperatures (CETs). I’ve taken the mean (rather than maximum or minimum) as the best indicator of heatwave severity and the fact that the CET covers a reasonably large area smooths out the signal.
As Fig 1 indicates, the UK (unlike other parts of western Europe) has not experienced heatwaves this July as anomalous as those in May and June, although, as recorded on the TORRO site, daily high temperature records were broken for 9th, 10th and 29th July.
How Freakish is 2026?
The first question is whether more severe heatwaves are possible. Just for fun I’ve taken the graph in Fig 1 and added a line (red) through the peaks of the extreme heatwaves in May and June 2026 as well as July 2022. I made this a straight line, though in reality a curve would no doubt more accurately capture what is possible. I then drew another straight line (blue) through the most severe historic heatwave high points, which were in early June 1947 and early July 1976:
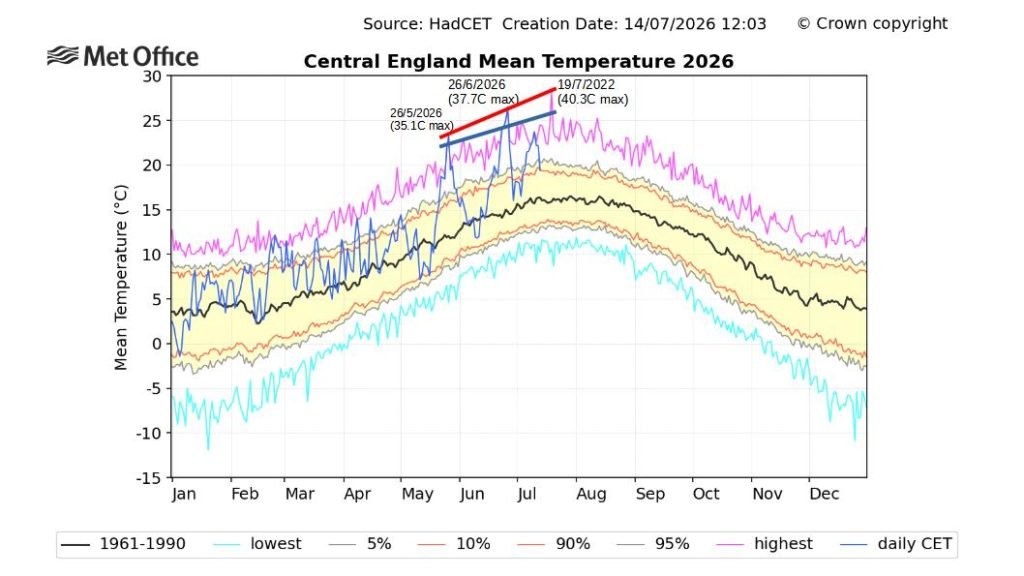
If the potential for hotter heatwaves has increased uniformly in recent decades because of global warming I would have expected these lines to be roughly parallel. They’re not. The most likely possibility, it seems to me, is that the June 1947 heatwave, with 34.4C recorded at Waddington, Lincolnshire and Kensington Palace, London on 3rd was more freakish than the heatwave this May. Based on TORRO‘s data, that reading on 3rd June 1947 was a notable date record (by which I mean the record temperature, in this case, so early in the year) until eclipsed by this May’s heatwave. Before as late as 2017 (34.5C at Heathrow on 21st), 34.4C had not been exceeded earlier than 26th June, when 35.4C was recorded in 1976.
The 1947 heatwave is also notable for coming so soon after exceptionally harsh winter weather.
There’s a slight proviso that 1947 might predate the period of global cooling due to industrial pollution which I wrote about in May. In this interpretation it is instead 1976 which “should” have been even hotter so that the lines in Fig 2 were more parallel.
My very tentative gut feel conclusion based on the back of this envelope is that 38C (revised upwards by the Met Office after I produced Fig 1) on 26th June 2026 and 40.3C on 19th July 2022 are closer to the possible maxima on those dates than was 35.1C on 26th May 2026, shocking though it was for such heat to occur so early in the summer.
Frequent Severe Heatwaves
A related question is how likely now, with global warming, are heatwaves like those that have occurred so far in summer 2026? Are they once a century events or once in a decade events? The sheer number of heatwaves over the last decade suggest that the second estimate is more likely to be accurate. Here are a few events I’ve discussed in previous years on this blog:
34.4C on 13th September 2016, a date record (hottest so late in the year), not as significant as those (earlier) in the Septembers of 1911 and 1906, but over 2.5C hotter than the record for any date later in the year! [I expect September daily maximum temperature records to be shattered sometime in the next few years, quite possibly this year].
34.5C on 21st June 2017, another date record (hottest so early in the year), eclipsed this May, of course.
34+C for 6 consecutive days during the forgotten heatwave of 2020.
40.3C on 21st July 2022, of course, the hottest temperature on record.
22.9C on 29th October 2022.
32.2C on 10th June 2023, with several subsequent days reaching a similar temperature.
29.3C on 1st May 2025, which should be classified as yet another date record.
So it may be that at least some of the heatwave episodes this year have been the sort of event we can now expect to occur frequently – once a decade, say – whereas something more severe will occur very occasionally, as the heatwave of June 1947 did in an earlier climate era. Perhaps a comparable heatwave now would see temperatures peaking at 36C or even 37C in late May or early June, rather than the 35C we’ve seen this year.
In Part 2 I’ll reflect on how the UK climate regime has changed in recent years.