Maybe May Be Too Darn Hot!
The May 2026 UK (and west of Europe) heatwave is notable in itself, with temperatures occurring in London – technically still in spring – hotter than any recorded up to a month later in the year. This should spur action to be prepared, in London, for example, for even higher temperatures during heatwaves in the summer months.
34.8C on 25th May 2026!
This is starting to get a little bit silly. We have yet another heatwave here in London, with a new and quite astonishing date record for the UK – that is, the hottest so early in the year (see, for example, the start of my previous post on the topic for an explanation of the terminology) in this case of 34.8C at Kew Gardens yesterday, Monday 25th May.
And it’s a notable date record: that 34.8C is the hottest on record before 26th June when 35.4C was recorded in a couple of places in the famously, freakishly hot summer of 1976.
And it’s similarly hot today, Tuesday 26th May. I’m hunkered down indoors but my outdoor thermometer earlier on radioed in temperatures in excess of 33C here in Ealing. (Note: before I’d finished writing this post the Met Office reported that the temperature reached 35.1C today, 26th May 2026, in Kew Gardens).
Heatwaves Tell Us a Lot
Heatwaves are not just a problem in themselves – especially in a city so ill-prepared for global warming (GW) as London – they also give us a very good idea of how GW is progressing without the need to process vast amounts of data. Analysis of how hot it can possibly get captures the essence of GW – the effect of changing physical climatic parameters – very efficiently. If you work smart then working hard is optional.
That’s why this is my 21st(!) post assigned to the Heatwave category!
Here’s an interesting graph I came across on Twitter yesterday, courtesy of @MetJam (using Met Office data):
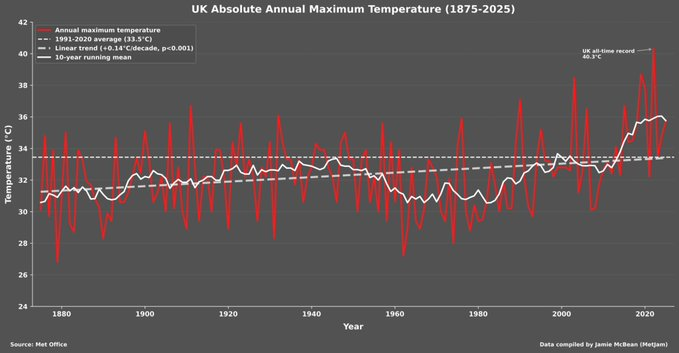
What might be well worth talking about is the dip in average (running mean) annual maximum temperatures this graph shows from the late 1940s to the early 1980s when they started to get back on trend. I suggest this dip is due to “global cooling” – air pollution, primarily from burning dirty fossil fuels, counteracting GW caused by greenhouse gases (GHGs), i.e. principally carbon dioxide, methane and nitrous oxide – perhaps with a bit of volcanic cooling thrown in.
If we were to strip out global cooling then the trend line in the above graph would be somewhat steeper, meaning we can expect average annual maximum UK temperatures to continue to increase by rather more than the ~0.2C/decade it implies.
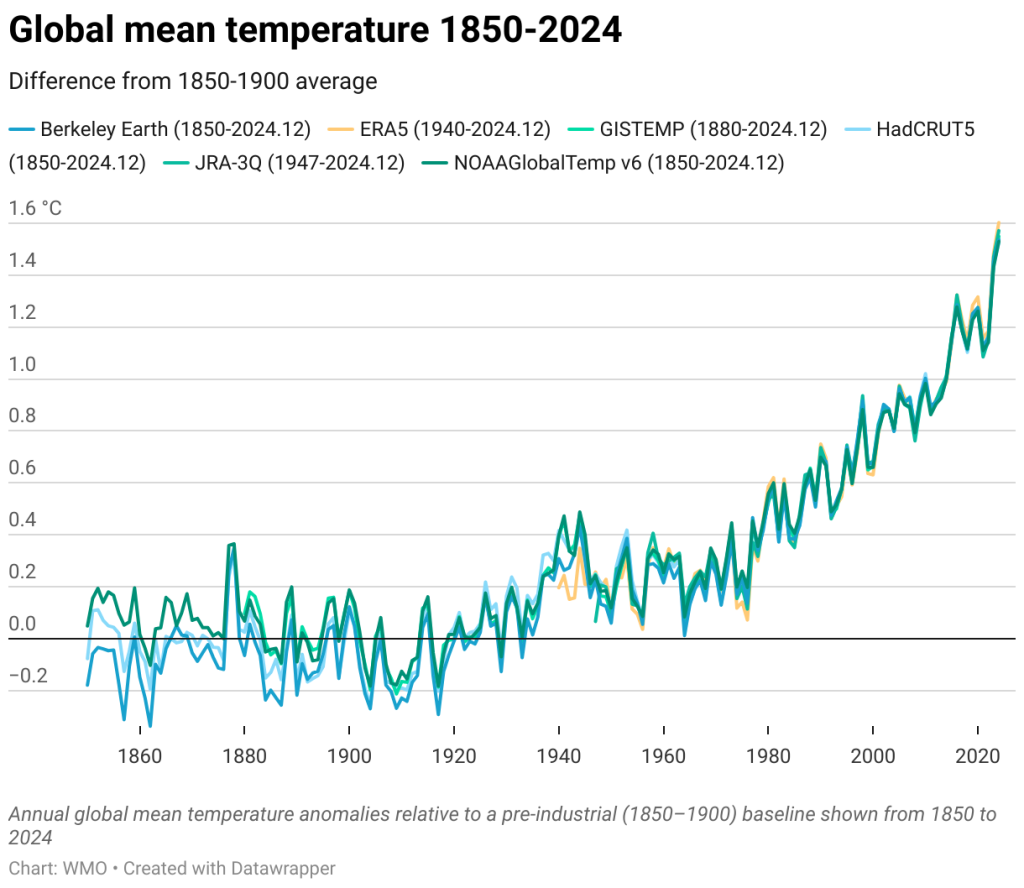
Furthermore, it may be that the underlying trend (that is, discounting global cooling) is not linear, but (at least for a period) exponential, since GW has speeded up over recent decades. The graph below, from the World Meteorological Organisation (WMO) suggests this, though the data represented are also affected by global cooling, and also by cumulative warming, i.e. oceanic heat retention:
Updated UK Date Record Series
Back in 2017 I provided a list of date records from June to August. This is now completely out of date – not least because the record I was writing about then has just been blown away! – so here is the new series up to the new all-time record of 40.3C recorded on 19th July 2022 (data from TORRO, taking into account the book “The Wrong Kind of Snow” annotated by myself from Met Office data):
| Temperature record | Date | Number of days |
| 34.8 | 25th May 2026 | 1 |
| 35.1* | 26th May 2026 | 31(!) |
| 35.4 | 26th June 1976 | 1 |
| 35.5 | 27th June 1976 | 1 |
| 35.6 | 28th June 1976 | 3 |
| 36.7 | 1st July 2015 | 17 |
| 38.2 | 18th July 2022 | 1 |
| 40.3 | 19th July 2022 | n/a (all-time record temperature) |
The * is for a provisional report from the Met Office heard on the radio as I’m writing. Historic date records through April and May are tricky due to what appears to be spurious data from Camden Square, as discussed in my previous post. I’ll think about this and maybe produce a table discounting Camden Square entirely.
What This Heatwave Might Tell Us
We now know that the temperature in the UK can reach 35C by 26th May in the current climate regime. We didn’t know this last week!
Taking into account the 40.3C recorded on 19th July 2022, we can extrapolate and surmise, for example, that temperatures as high as 38C are possible before the end of June.
Here’s a slightly more subtle point. We know that 1976 was a freak summer, but average annual mean temperatures in the UK have risen by less than 2C since then:
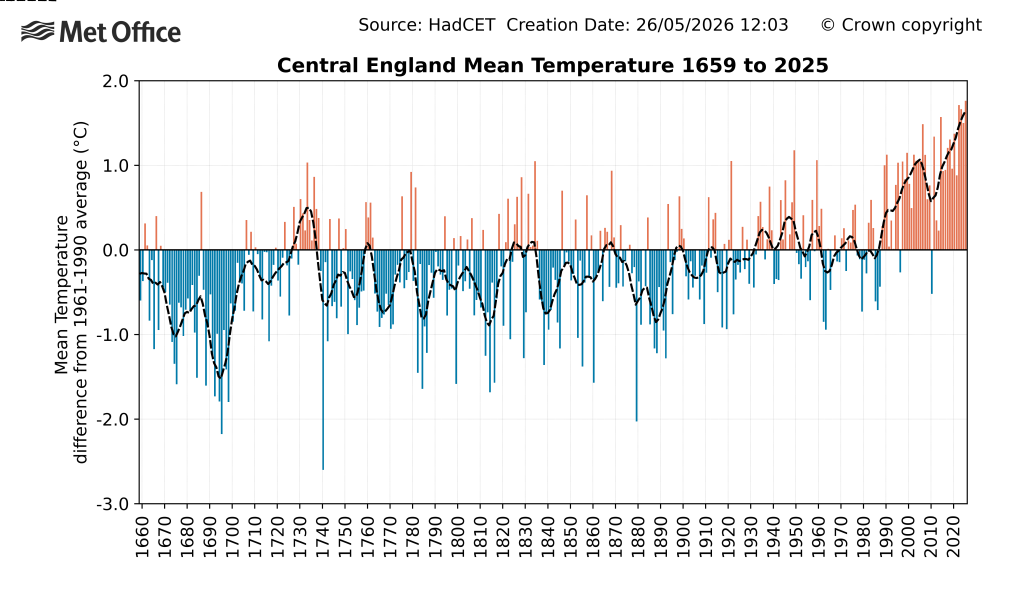
The extrapolation of 38C for late June compared to 35.6C in 1976 suggests peak temperatures increase faster than mean temperatures.
Furthermore, the frequency of record temperatures – for example 2015, 2022 and 2026 in the above table, not to mention the superceded record from 2017 – suggests that these records might not all be as hot as it can get on those dates. A different weather pattern, such as the extended build-up of heat in 1976, could, one supposes, lead to higher temperatures than we’ve experienced so far this decade.
London, in particular, should perhaps prepare for multi-day periods of temperatures peaking daily at 38-40C, which it seems could now occur any time from late June to late August. Such heatwaves have not yet occurred, with temperatures only spiking to such a level.